Wine Nerds: Is there a difference in median Price between Napa & Sonoma

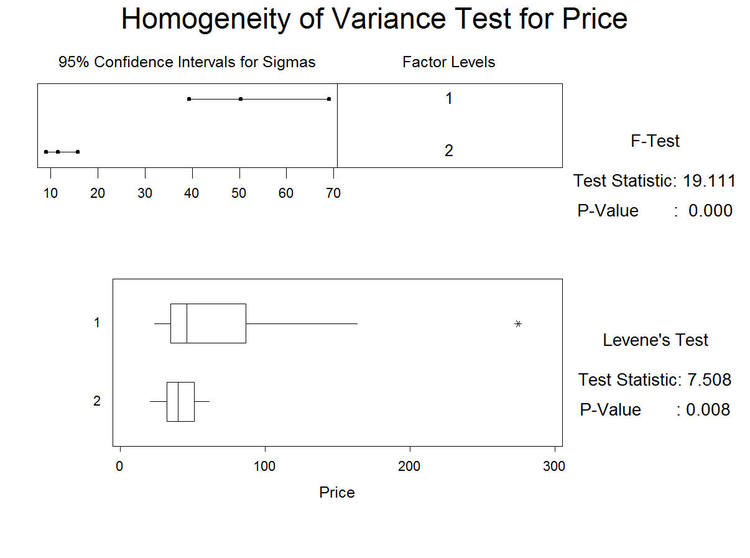
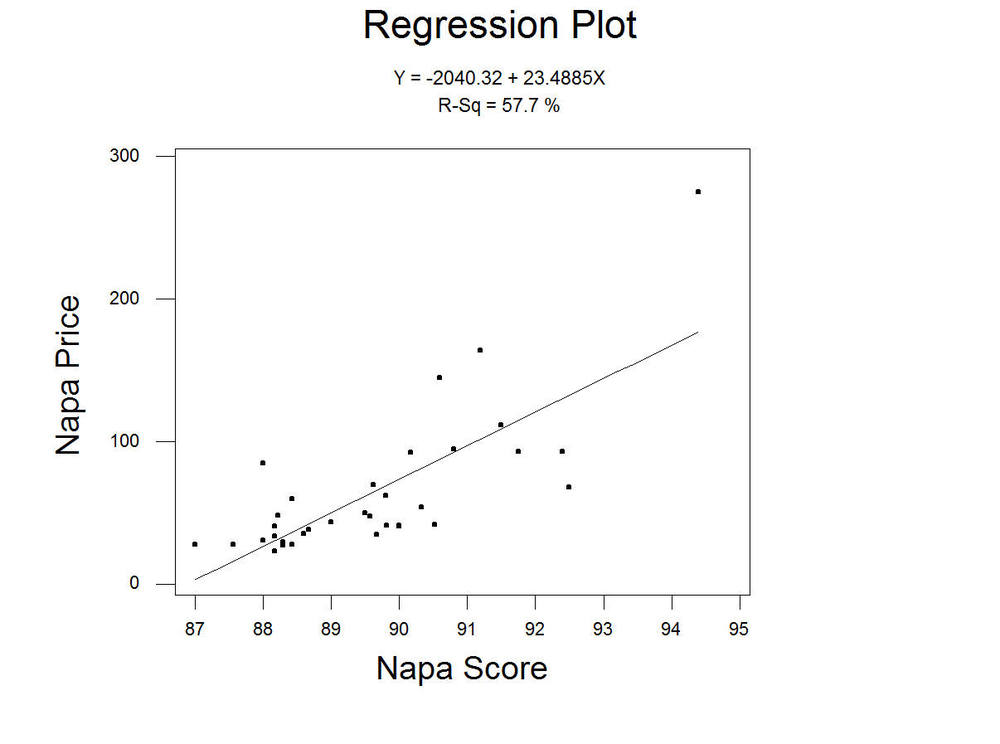
This hypothesis testing is trying to determine if there is a difference in median Price between Napa and Sonoma.

Step 1: Define the Hypothesis
HoNo difference in mean between Napa (1)  and Sonoma(2) prices
H1Difference in mean between Napa (1)  and Sonoma(2) prices

Step 2

Step 3 Explain the results
We fail to reject the null hypothesis
The P-value for Mood’s median test is >.05 which leads us to conclude that there is no difference in the medians between Napa and Sonoma prices.

Step 4 Conclusion
There is no statistical difference in the medians between Napa and Sonoma prices.
(*) We picked the mood median test because one of the two samples is non-normal.

Wine Nerds: Is there a difference in the Price spread between Napa & Sonom

This hypothesis testing is trying to determine if there is a difference in variance in Price between Napa and Sonoma.  It will explore whether the price spread is different based on the region.

Step 1 Define my Hypothesis
Ho: There is no difference in the Price spread between Napa and Sonoma
H1: There is a difference in the Price spread between Napa and Sonoma

Step 2: Run the HOV test (Homogeneity of Variance) 

Step 3 Explain the results
Reject the Null Hypothesis.
The P-value for Levene's test is <.05 which leads us to conclude that there is a difference in the spread between the prices in Sonoma and Napa.

Step 4: Conclusion
There is a statistical difference between the spread for the prices in Sonoma and Napa.  Also, if you look at the graph above you can see the spread is much wider for Napa (1) than Sonoma (2).  It basically means there is more variance in Napa prices than Sonoma.

Wine Nerds: Is there a Correlation between WS Scores & Prices for Napa Wines

This hypothesis testing is to try to understand if there is correlation between the average scores given by wine spectator and the average prices for wineries in Napa.

Step 1 Define my Hypothesis
Ho: There is no correlation between WS Score and Price for Napa Wines
H1: there is a correlation between WS Score and price for Napa wines

Step 2 run the regression Analysis
The regression equation is Napa Price = - 2040 + 23.5 Napa Score

Predictor        Coef       StDev          T        P
Constant      -2040.3       318.8      -6.40    0.000
Napa Sco       23.488       3.557       6.60    0.000 
S = 33.21       R-Sq = 57.7%     R-Sq(adj) = 56.4%
Analysis of Variance

Source            DF          SS          MS         F        P
Regression         1       48111       48111     43.61    0.000
Residual Error    32       35301        1103
Total             33       83412

Unusual Observations
Obs   Napa Sco   Napa Pri         Fit   StDev Fit    Residual    St Resid
21       92.5             68.33        132.36   11.72         -64.03       -2.06R
29      94.4            275.00       176.99   17.92          98.01        3.51RX
R denotes an observation with a large standardized residual
X denotes an observation whose X value gives it large influence.

Step 3 Explain the results
We Reject the null hypothesis.

The P-value for Napa Score  is <.05 which leads us to conclude that Score is a good predictor of Price and there is a correlation between Score and Price

The R-sq(adj) value is high, which tells us that the regression equation explains a high percentage of the variation in the process (close 60%).

Step 4 Conclusion
It looks like that score is a strong predictor of a price for Napa wines.
Note:"Correlation does not imply causation

Wine Nerds: Is there Correlation between WS Scores & Prices for Sonoma Wines

This hypothesis testing is to try to understand if there is correlation between the average scores given by wine spectator and the average prices for wineries in Sonoma.

Step 1: Define the Hypothesis
Ho: There is no correlation between WS score and Price for Sonoma wines
H1: there is a correlation between WS score and price for Sonoma wines

Step 2 run the regression Analysis
The regression equation is  Sonoma Price = - 389 + 4.78 Sonoma Score

Predictor           Coef       StDev           T        P
Constant       -388.5       106.2      -3.66    0.001
Sonoma S        4.783       1.185       4.04    0.000
S = 9.461       R-Sq = 32.4%     R-Sq(adj) = 30.4%

Analysis of Variance
Source               DF          SS          MS          F            P
Regression         1      1458.3      1458.3     16.29    0.000
Residual Error    34      3043.3        89.5
Total             35      4501.6

Step 3 Explain the results
We reject the null hypothesis.

The P-value for Score  is <.05 which leads us to conclude that score is a good predictor of Price and there is correlation between Score and Price for Sonoma wines.

The R-sq(adj) value is low, which tells us that the regression equation can only explains about 30% of the variation, we therefore conclude that there are other factors that can explain variation.

Step 4 Conclusion
There is a correlation between scores and prices other factors are at play.
Note:"Correlation does not imply causation

Wine Nerds: Wine & Statistics

The Wineries

The Wineries

Last week I attended a statistics class I wanted to apply some of the concepts to a real life example.After looking for a data set I remembered a spreadsheet a friend sent me before visiting Napa/Sonoma.  the spreadsheet included Wine Spectator's Scores and costs of the wines.

The next series of article will be looking at the data in a statistical approach.  We will be looking at the correlation of Score v. Price and Price between regions, etc.  Below is the list of wineries that will included in the study.