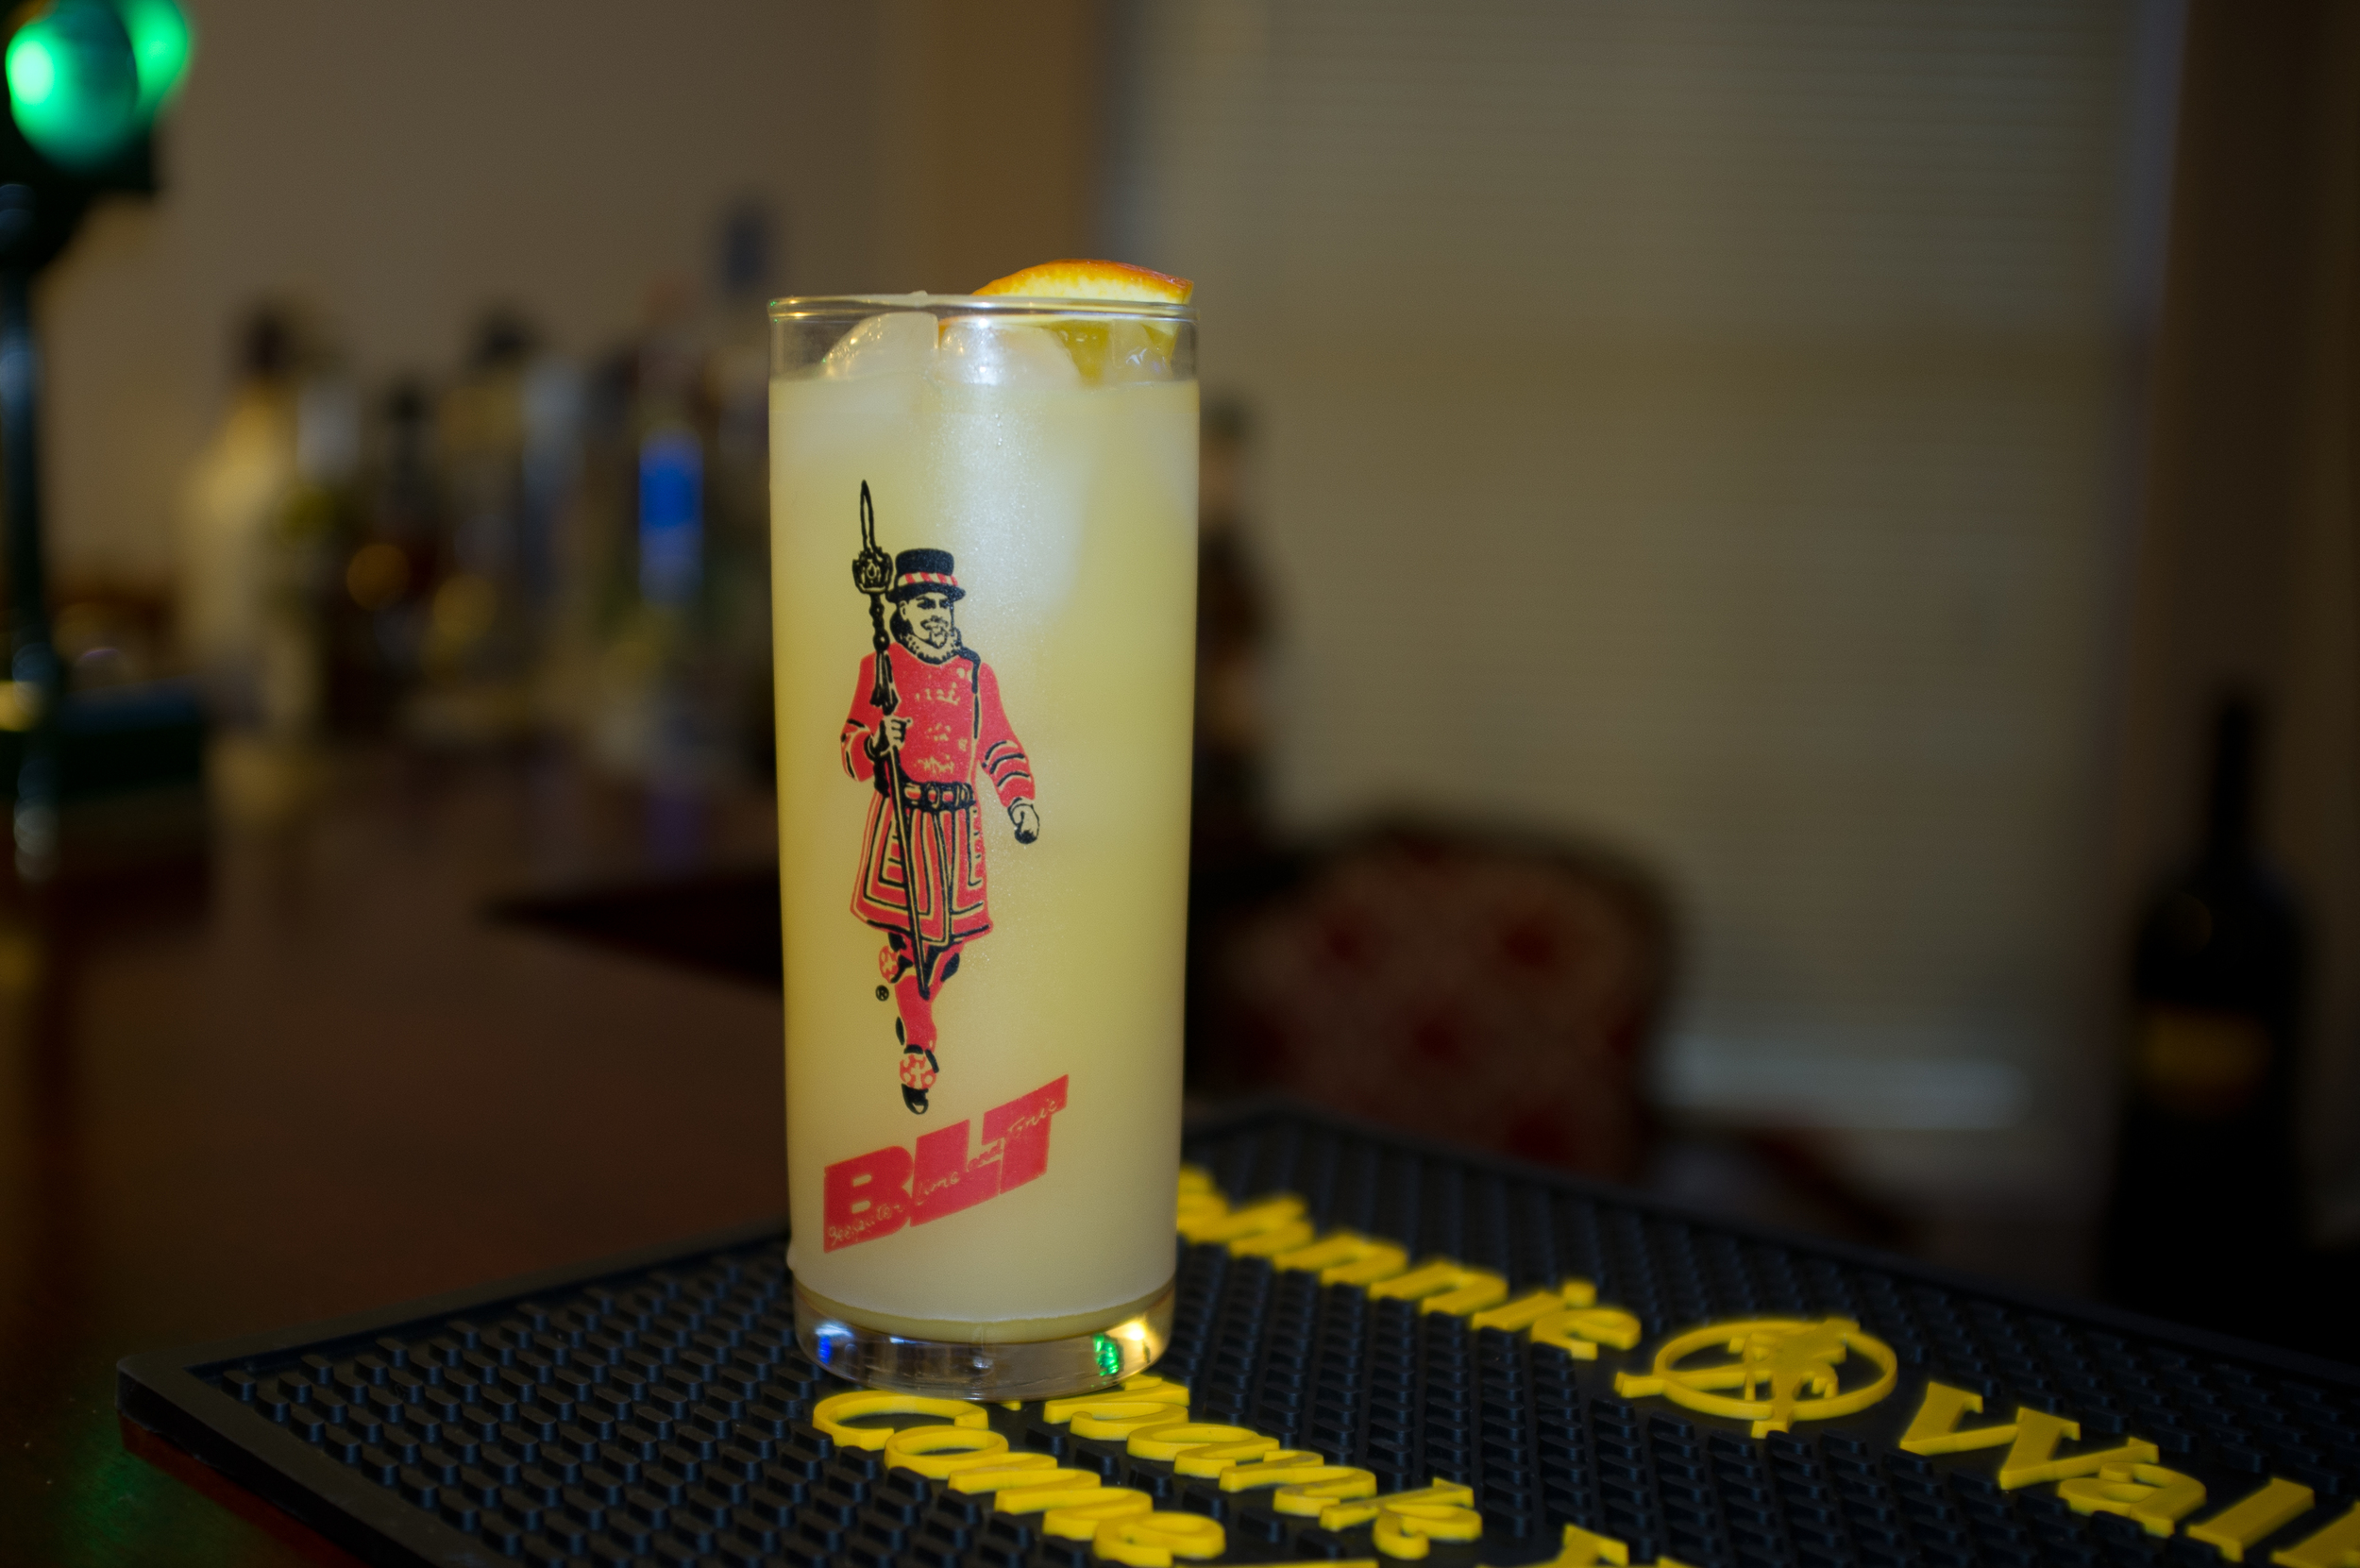
A simple refreshing drink.
Recipe
- 1/2 Gin
- 1/2 Orange juice
- 1/2 an Orange Slice
A simple refreshing drink.
Recipe
- 1/2 Gin
- 1/2 Orange juice
- 1/2 an Orange Slice
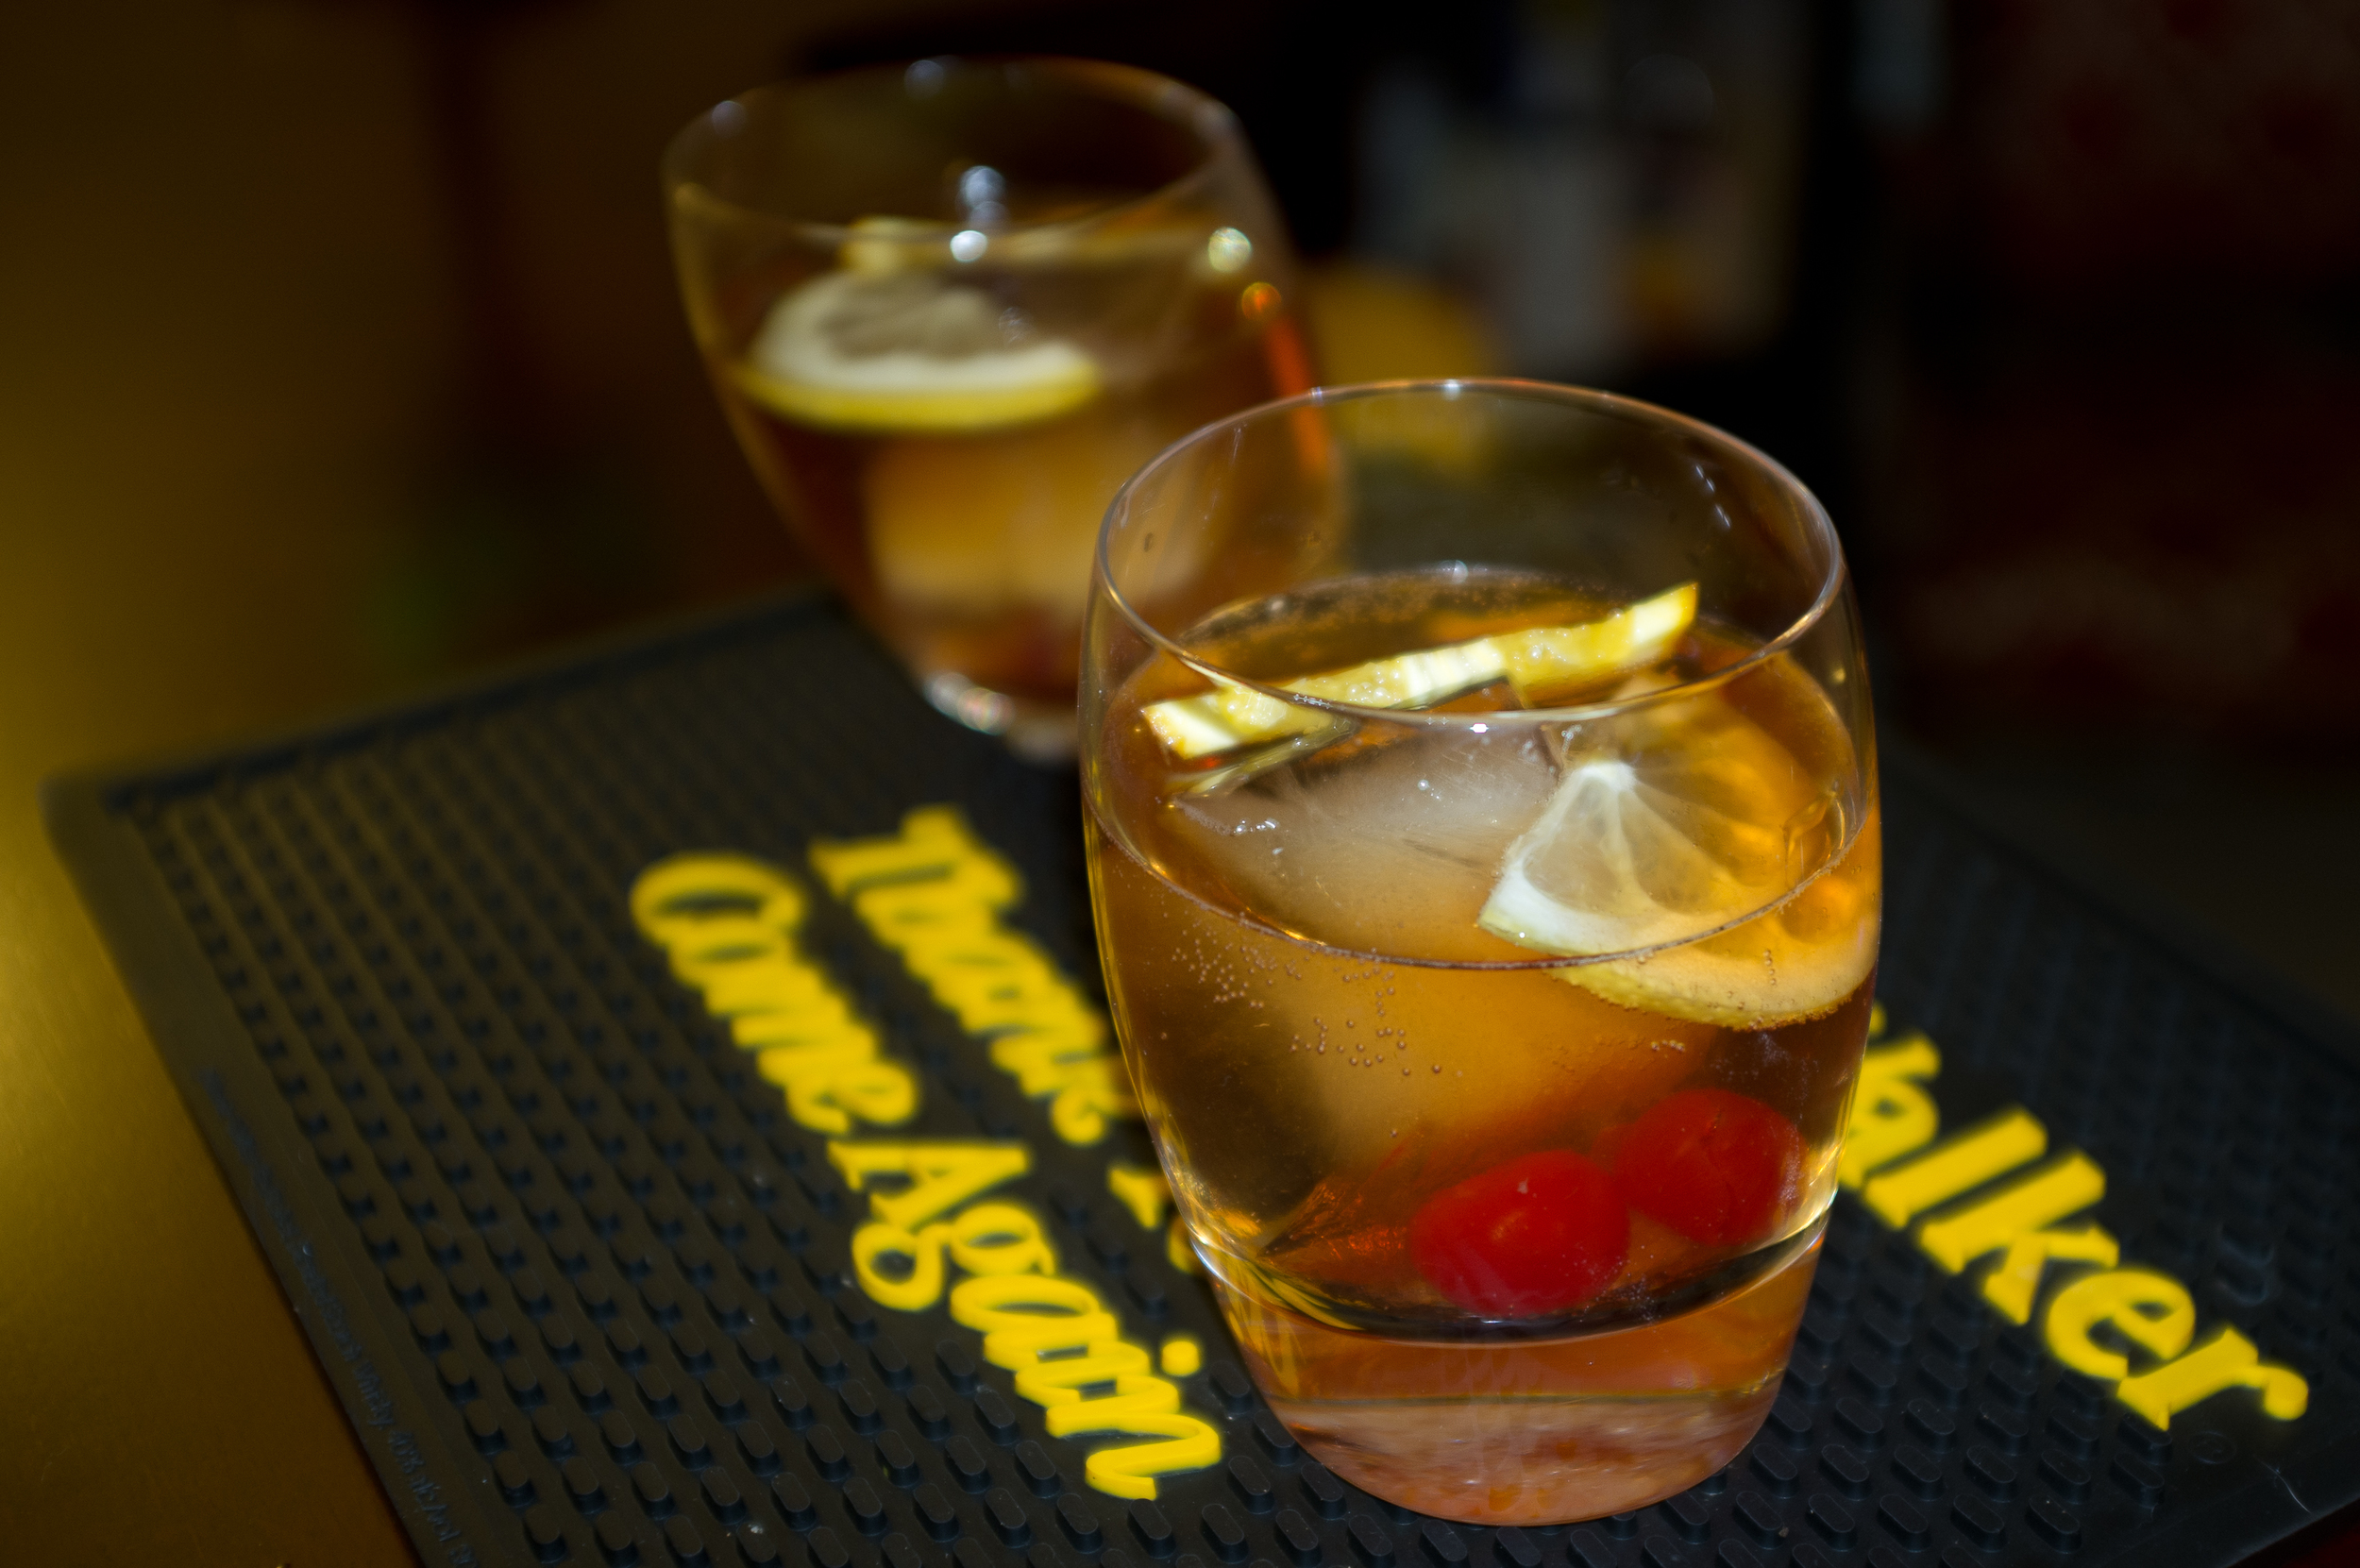
This week is a great classic, the Bourbon is the center piece of the drink, the ingredient are paramount for this coctail.
Recipe
- Bourbon
- 1 dash of sparkling water
- 1 sugar cube
- 1/2 slice of orange
- 1/2 slice of lemon
- 2 maraschino cherries
This week is a well balanced drink, nice blend of aromatics and fruits, but it is a strong dry drink.
Recipe
- 3/5 Gin
- 2/5 Orange Juice
- 2 dashes grenadine
- 2 dashes Ricard
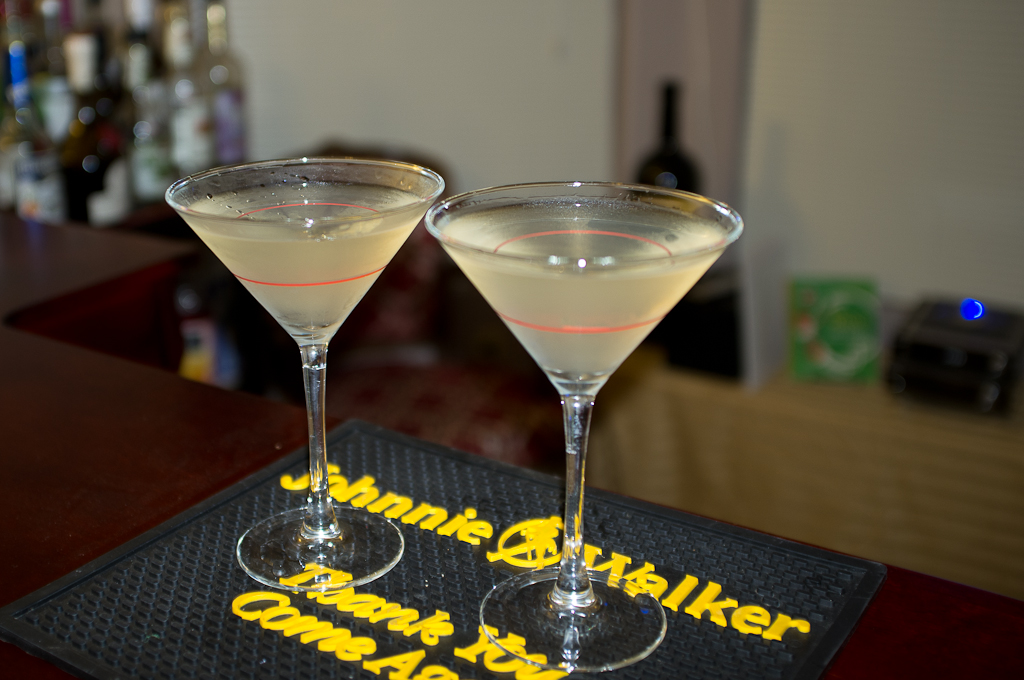
This week is the mother of all classics: The Dry Martini. This is a drink that will let the Gin shine, the better the quality, the aromatics, the better the drink. In a future post we will reveal some of the Gin's we have been experimenting with.
Recipe
-3/4 Gin
- 1/4 dry vermouth
- 1 olive
- Olive brine for a dirty martini.
This week we are trying a real man's drink... The blend of vermouth and scotch gives it a funky nose, wonderful flavor, not a beginner's drink. We try with single malt, it is much better with a blended scotch, the peat of a single malt is too much for the drink.
Recipe
- 1/2 Scotch whisky
- 1/4 dry vermouth
- 1/4 sweet vermouth
- 2 dashes of Angostura
This week we are trying another old classic. It ends up being fresh, beautiful, well balanced, a wonderful summer drink.
Recipe
- 1/3 dry gin
- 1/3 dry vermouth
- 1/6 apricot brandy
- 1/6 cointreau
This week is an old classic rarely done (at least the right way): The Whisky Sour. I prefer it with a somewhat neutral (not too much sweetness, wood, or peat)like Canadian Whisky. It is the right a well balanced drink with touch of sourness. A great Classic.
Recipe
- 2 parts of Whisky
- 1 part of simple syrup
- 1 part lemon juice
- 1 teaspoon egg white (buy in the pasterized one in cartons, it keeps)
This week is the big daddy of classics: The Manhattan. It can be done with Canadian Whisky, Bourbon, and Rye. It is just perfection, the right balance of ingredient and depending on the whisky the flavors can vary greatly, but always a great drink.
Recipe
- 2/3 Canadian Whisky (70's version)
- 1/3 Sweet Vermouth
- 1 dash Angostura (bitter)
This week coctail is the Stinger, it lacks something, no big effect, maybe a higher quality Brandy or a dash of orange bitter would work.
Recipe
- 2/3 Brandy
- 1/3 Cream de Mint (white)
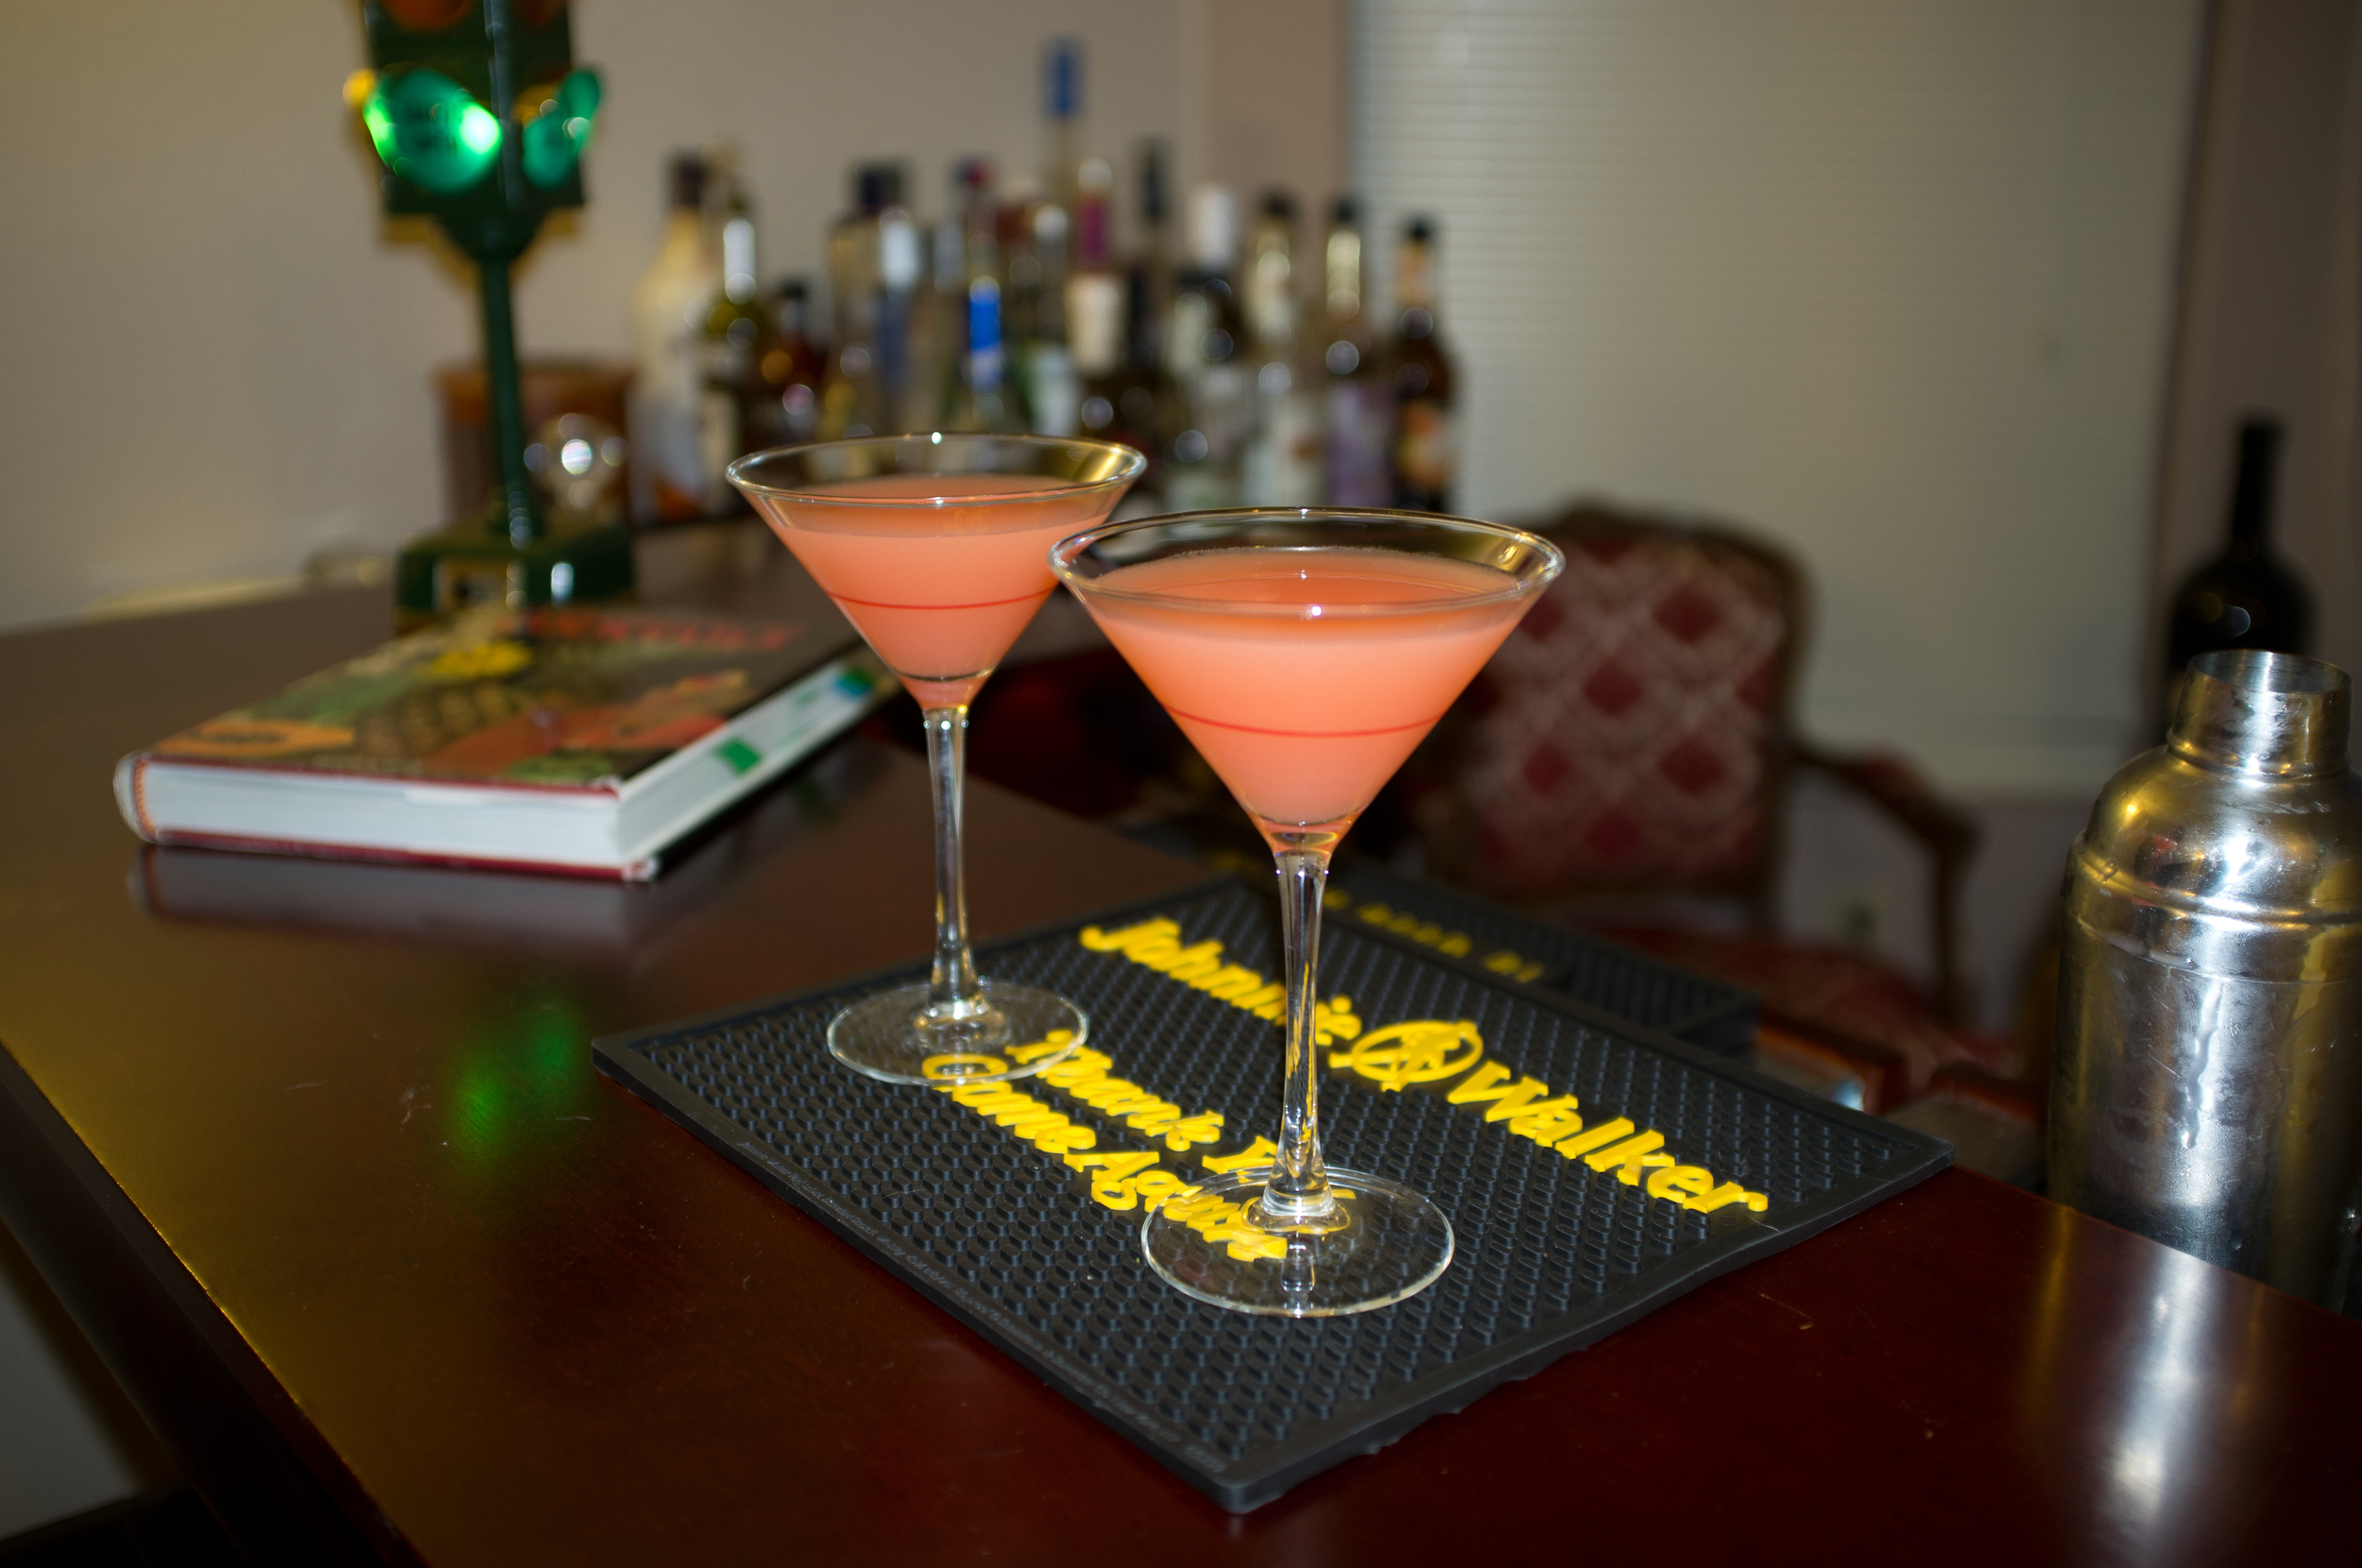
Our next coctail is Mary Pickford, a good coctail, on the sweet side, great for parties, easy to drink.
Recipe
1/2 White Rhum
1/2 Pineapple Juice
1 teaspoon of Grenadine
6 dashes of Maraschino
Azwinegroup is going to go through the classic cocktails over the next few month, today is the Negroni, a great cocktail with the right balance of sweetness and bitterness.
Recipe
1/3 Vermouth
1/3 Campari
1/3 Dry Gin
1 Orange Slice
In Part III I discussed the different wines you should own in your collection. In this the fourth and final installment I will discuss how your overall collection will look at the highpoint of the first year and how to continue building.
As you have by now purchased a complete assortment of wines for the year, or at least are planning to, your collection will look something like this.
Fill in additional space with other reds and whites that you discover such as pinot gris, Barolo and special wines. Remember at least 1/3 of these bottles are going to be rotating out every year and your house wines may not even have to go in the fridge depending on where you live giving you ample room to lay down your special wines and avoid them. Begin saving for a 200-500 bottle storage solution. After 5 years you are going to have 40-60 bottles of world class Cabernet and Bordeaux alone. By design your house wine will become single vineyard fine vintage wines rivaling the best restaurant wine lists in the world. This is a good plan.
Just as a restaurant would, keep a favorite “house wine” in rotation until you find something you like better or is a better value. When you go to wine tastings, restaurants, or out with friends, don’t order what you can have at home. Stretch yourself and try something new. You may find a house wine for the upcoming cellar rotation, or even better, a value or special wine to savor in the future.
A few years ago my friend Andy corrected me when I said Meritage the “French way" (sounding like mirage), but off course there is no such word in French. The term was created by a group of Napa wine maker in the late 80's to describe a California Bordeaux blend. It was formed by joining the words Merit and heritage and is pronounced like Heritage not like Mirage.
Meritage [mer-i-tij].
It was fun (in a sick way) to apply some basic statistical approach to something I enjoy so here is some parting thoughts on this topic.
Napa has a wider spread in pricing than Sonoma’s. I think it makes sense, Napa makes a wide range of wines from daily drinker to cult wines and is better known to casual drinkers. Ask some of your casual wine drinking friends if they recognize the name Silver Oak, Modavi or Dumol? I think in most cases people will have heard of the Napa guys and have no idea about Dumol, Rochioli or Selyem all amazing Sonoma winery.
This brings me to pricing and scores. Why are Napa prices and scores so strongly correlated? The simple look at it is that the better the wine is, the more expensive it is, therefore gets a high price and high score… Or is pricing driven by score? I would hope not. I believe this is one of those where we can say correlation doesn’t mean causation. Scores and prices are driven by other factors, such as production level, winemaker, weather, location, etc.
Hope you enjoyed the series of articles. More to come in 2013.
This hypothesis testing is trying to determine if there is a difference in mean Price between Napa and Sonoma.
Step 1: Define the Hypothesis
Ho: No difference in mean between Napa (1) and Sonoma(2) scores
H1: Difference in mean between Napa (1) and Sonoma(2) scores
Step 2 Run the One Way Anova
Step 3 Explain the results
We fail to reject the null hypothesis
The P-value for Mood’s median test is >.05 which leads us to conclude that there is no difference in the means between Napa and Sonoma scores.
Step 4 Conclusion
There is no statistical difference in the means between Napa and Sonoma scores. The one thing to add here is that the way our sample was for all wine with a score of 87 or more which may skew the result.
(*)We picked One way ANOVA because both samples are normal
This hypothesis testing is trying to determine if there is a difference in median Price between Napa and Sonoma.
Step 1: Define the Hypothesis
Ho: No difference in mean between Napa (1) and Sonoma(2) prices
H1: Difference in mean between Napa (1) and Sonoma(2) prices
Step 2
Step 3 Explain the results
We fail to reject the null hypothesis
The P-value for Mood’s median test is >.05 which leads us to conclude that there is no difference in the medians between Napa and Sonoma prices.
Step 4 Conclusion
There is no statistical difference in the medians between Napa and Sonoma prices.
(*) We picked the mood median test because one of the two samples is non-normal.
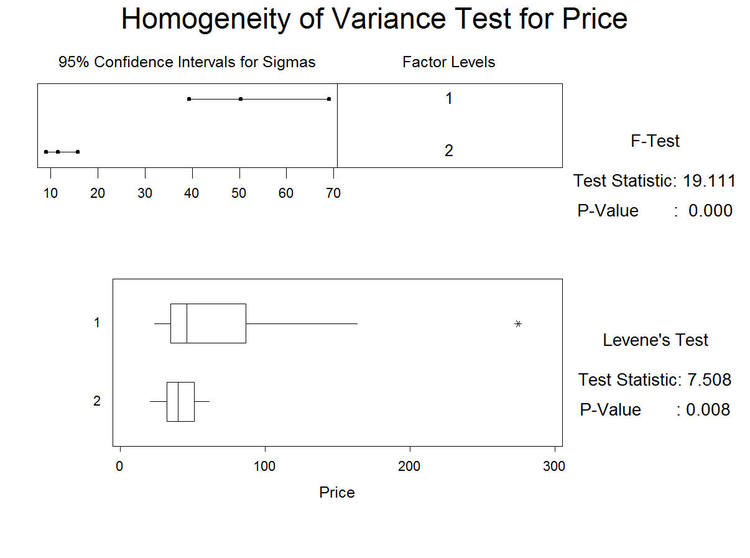
This hypothesis testing is trying to determine if there is a difference in variance in Price between Napa and Sonoma. It will explore whether the price spread is different based on the region.
Step 1 Define my Hypothesis
Ho: There is no difference in the Price spread between Napa and Sonoma
H1: There is a difference in the Price spread between Napa and Sonoma
Step 2: Run the HOV test (Homogeneity of Variance)
Step 3 Explain the results
Reject the Null Hypothesis.
The P-value for Levene's test is <.05 which leads us to conclude that there is a difference in the spread between the prices in Sonoma and Napa.
Step 4: Conclusion
There is a statistical difference between the spread for the prices in Sonoma and Napa. Also, if you look at the graph above you can see the spread is much wider for Napa (1) than Sonoma (2). It basically means there is more variance in Napa prices than Sonoma.
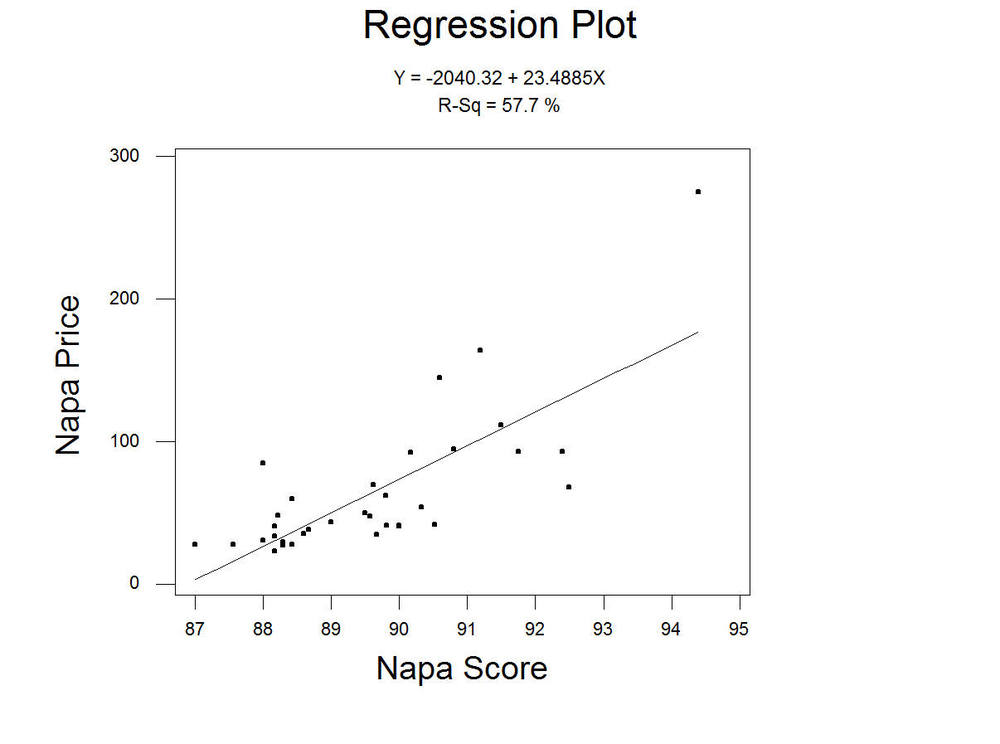
This hypothesis testing is to try to understand if there is correlation between the average scores given by wine spectator and the average prices for wineries in Napa.
Step 1 Define my Hypothesis
Ho: There is no correlation between WS Score and Price for Napa Wines
H1: there is a correlation between WS Score and price for Napa wines
Step 2 run the regression Analysis
The regression equation is Napa Price = - 2040 + 23.5 Napa Score
Predictor Coef StDev T P
Constant -2040.3 318.8 -6.40 0.000
Napa Sco 23.488 3.557 6.60 0.000
S = 33.21 R-Sq = 57.7% R-Sq(adj) = 56.4%
Analysis of Variance
Source DF SS MS F P
Regression 1 48111 48111 43.61 0.000
Residual Error 32 35301 1103
Total 33 83412
Unusual Observations
Obs Napa Sco Napa Pri Fit StDev Fit Residual St Resid
21 92.5 68.33 132.36 11.72 -64.03 -2.06R
29 94.4 275.00 176.99 17.92 98.01 3.51RX
R denotes an observation with a large standardized residual
X denotes an observation whose X value gives it large influence.
Step 3 Explain the results
We Reject the null hypothesis.
The P-value for Napa Score is <.05 which leads us to conclude that Score is a good predictor of Price and there is a correlation between Score and Price
The R-sq(adj) value is high, which tells us that the regression equation explains a high percentage of the variation in the process (close 60%).
Step 4 Conclusion
It looks like that score is a strong predictor of a price for Napa wines.
Note:"Correlation does not imply causation"
This hypothesis testing is to try to understand if there is correlation between the average scores given by wine spectator and the average prices for wineries in Sonoma.
Step 1: Define the Hypothesis
Ho: There is no correlation between WS score and Price for Sonoma wines
H1: there is a correlation between WS score and price for Sonoma wines
Step 2 run the regression Analysis
The regression equation is Sonoma Price = - 389 + 4.78 Sonoma Score
Predictor Coef StDev T P
Constant -388.5 106.2 -3.66 0.001
Sonoma S 4.783 1.185 4.04 0.000
S = 9.461 R-Sq = 32.4% R-Sq(adj) = 30.4%
Analysis of Variance
Source DF SS MS F P
Regression 1 1458.3 1458.3 16.29 0.000
Residual Error 34 3043.3 89.5
Total 35 4501.6
Step 3 Explain the results
We reject the null hypothesis.
The P-value for Score is <.05 which leads us to conclude that score is a good predictor of Price and there is correlation between Score and Price for Sonoma wines.
The R-sq(adj) value is low, which tells us that the regression equation can only explains about 30% of the variation, we therefore conclude that there are other factors that can explain variation.
Step 4 Conclusion
There is a correlation between scores and prices other factors are at play.
Note:"Correlation does not imply causation"
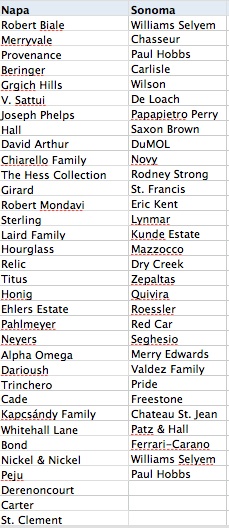
The Wineries
Last week I attended a statistics class I wanted to apply some of the concepts to a real life example.After looking for a data set I remembered a spreadsheet a friend sent me before visiting Napa/Sonoma. the spreadsheet included Wine Spectator's Scores and costs of the wines.
The next series of article will be looking at the data in a statistical approach. We will be looking at the correlation of Score v. Price and Price between regions, etc. Below is the list of wineries that will included in the study.